Clādēs Cimicum
 Collin Tod
April 10, 2018
Collin Tod
April 10, 2018
What Is It?
This program, Clādēs Cimicum, (which means ‘Bane of Bugs’ in Latin) is a very small and simple debugger for interprocess debugging. This is slightly different from that of GDB, since GDB actually creates a child process when debugging. Cladēs Cimicum can read the memory of any running process, without having to be run in some special environment beforehand.
Why I Wrote It
A while back, I found this challenge, and figured that I could do it. I started doing research into the best way to read the memory of another process, and found a few options:
- Using ptrace to attach to the process and read its memory (This is what GDB does to a child proces)
- Manually stopping the process and reading from its mem file in
/proc
I chose the latter of the two options because I wanted a bit of a challenge.
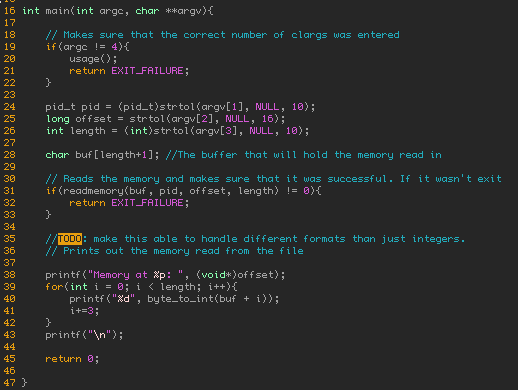
How To Use It
Program usage
debugger PID offset nbytes
where PID is the process ID of the target process, offset is the address in the virtual memory of the process that you wish to read from, and nbytes is the number of bytes to read from the target process
How It Works
First of all, a distinction must be made between the concept of a program, and the concept of a process. A program is the code that you write, and the binary file that it becomes when compiled, or the set of instructions executed as it is interpreted, or any number of other programming paradigms. In essence, it is the blueprint for behavior of the computer when that program is ‘run’. A process on the other hand, is an individual instance of that program running. For example, you can have two instances of vim running, each their own separate process, but using the same program.
As it turns out, a process on UNIX systems is nothing more than a collection of pseudo files stored in /proc. Everything about the process is stored in a folder within /proc, and the name of that folder for each process is the PID (Process ID) for that process. For example, if there is an instance of vim running with PID 413, everything about that specific process will be stored at /proc/413. In general, for any process, I will be referring to this location as /proc/PID.
Among the numerous useful files and folders within /proc/PID, one stands out as immediately useful for the problem at hand: /proc/PID/mem. This file holds ALL of the virtual memory mapped to a process. (I am aware that it is not technically a file, but going into the mechanics of what a pseudo filesystem is is beyond the scope of the description of this project). Therefore, you should be able to read all of the memory of a running process just by opening that file right? Well yes, but it is slightly more involved than that.
Firstly, the process that is to be examined (from here on out the target process) must not be running if you want to read the mem file. This is extrememly important in avoiding race conditions.. My solution to this is to simply pause the execution of the process by utilizing signalling. Before I attempt to read the mem file, the target process is stopped with SIGSTOP. The once reading is done, the process is continued with SIGCONT.
Secondly, you must be root to read the memory of another process in this way. It would be extremely unsafe for non-root or super users to be able to read the memory of any process on a machine at any time.
Thirdly, and maybe most importantly, you must know the exact memory address of the memory you want to access. This is because attempting to accesss an address in virtual memory that is not mapped to a physical address by /proc/PID/maps will result in an IO error. This makes sense, because there is no physical representation of the area of memory attemting to be accessed. Thus, you must be extremely familiar with the target process in order to effectively use this method.
How I Solved the Captcha Problem
The biggest challenge for this problem was actually finding the memory address of the answer to the captcha. Input is read in 1 by 1 so there is no array to immediately check against in the input function, where there is a blocking call to scanf. The solution I found however, does involve a simple array of ints that holds the answer. A stack frame always holds a pointer to the previous stack frame’s stack pointer. The stack pointer is a register that holds a memory address to the last piece of memory that was requested to be allocated on the stack. This piece of memory just so happened, in the previous stack frame, to be an array holding the answer. Done. Using GDB to grab this value (There is absolutely a way to do this not using GDB, but there was not enought time to research how to search the stack for this exact value), I simply used the Clādēs Cimicum program to grab the memory at that pointer and print it out. This is the solution to the captcha.
What I Learned
Pretty much everything that I know about the /proc folder, and how stack frames work.
The Project
The project is hosted here. The master branch is the general debugger, whilst the injection branch is the solution for the captcha challenge.
More blog posts